Executive Dashboard
This guide walks you through the executive dashboard, which gives you a high-level view of your agency’s identity security posture, active sessions, and compliance coverage. Use it to monitor risk, spot trends, and export reports for stakeholders.
Time to complete: About 3 minutes to review all sections.
- You need the Admin or Security Manager role to access the executive dashboard.
- The dashboard reflects live data – metrics update automatically as your team uses AccessHive.
Navigate to Executive Dashboard in the left sidebar.
Overview: stat cards
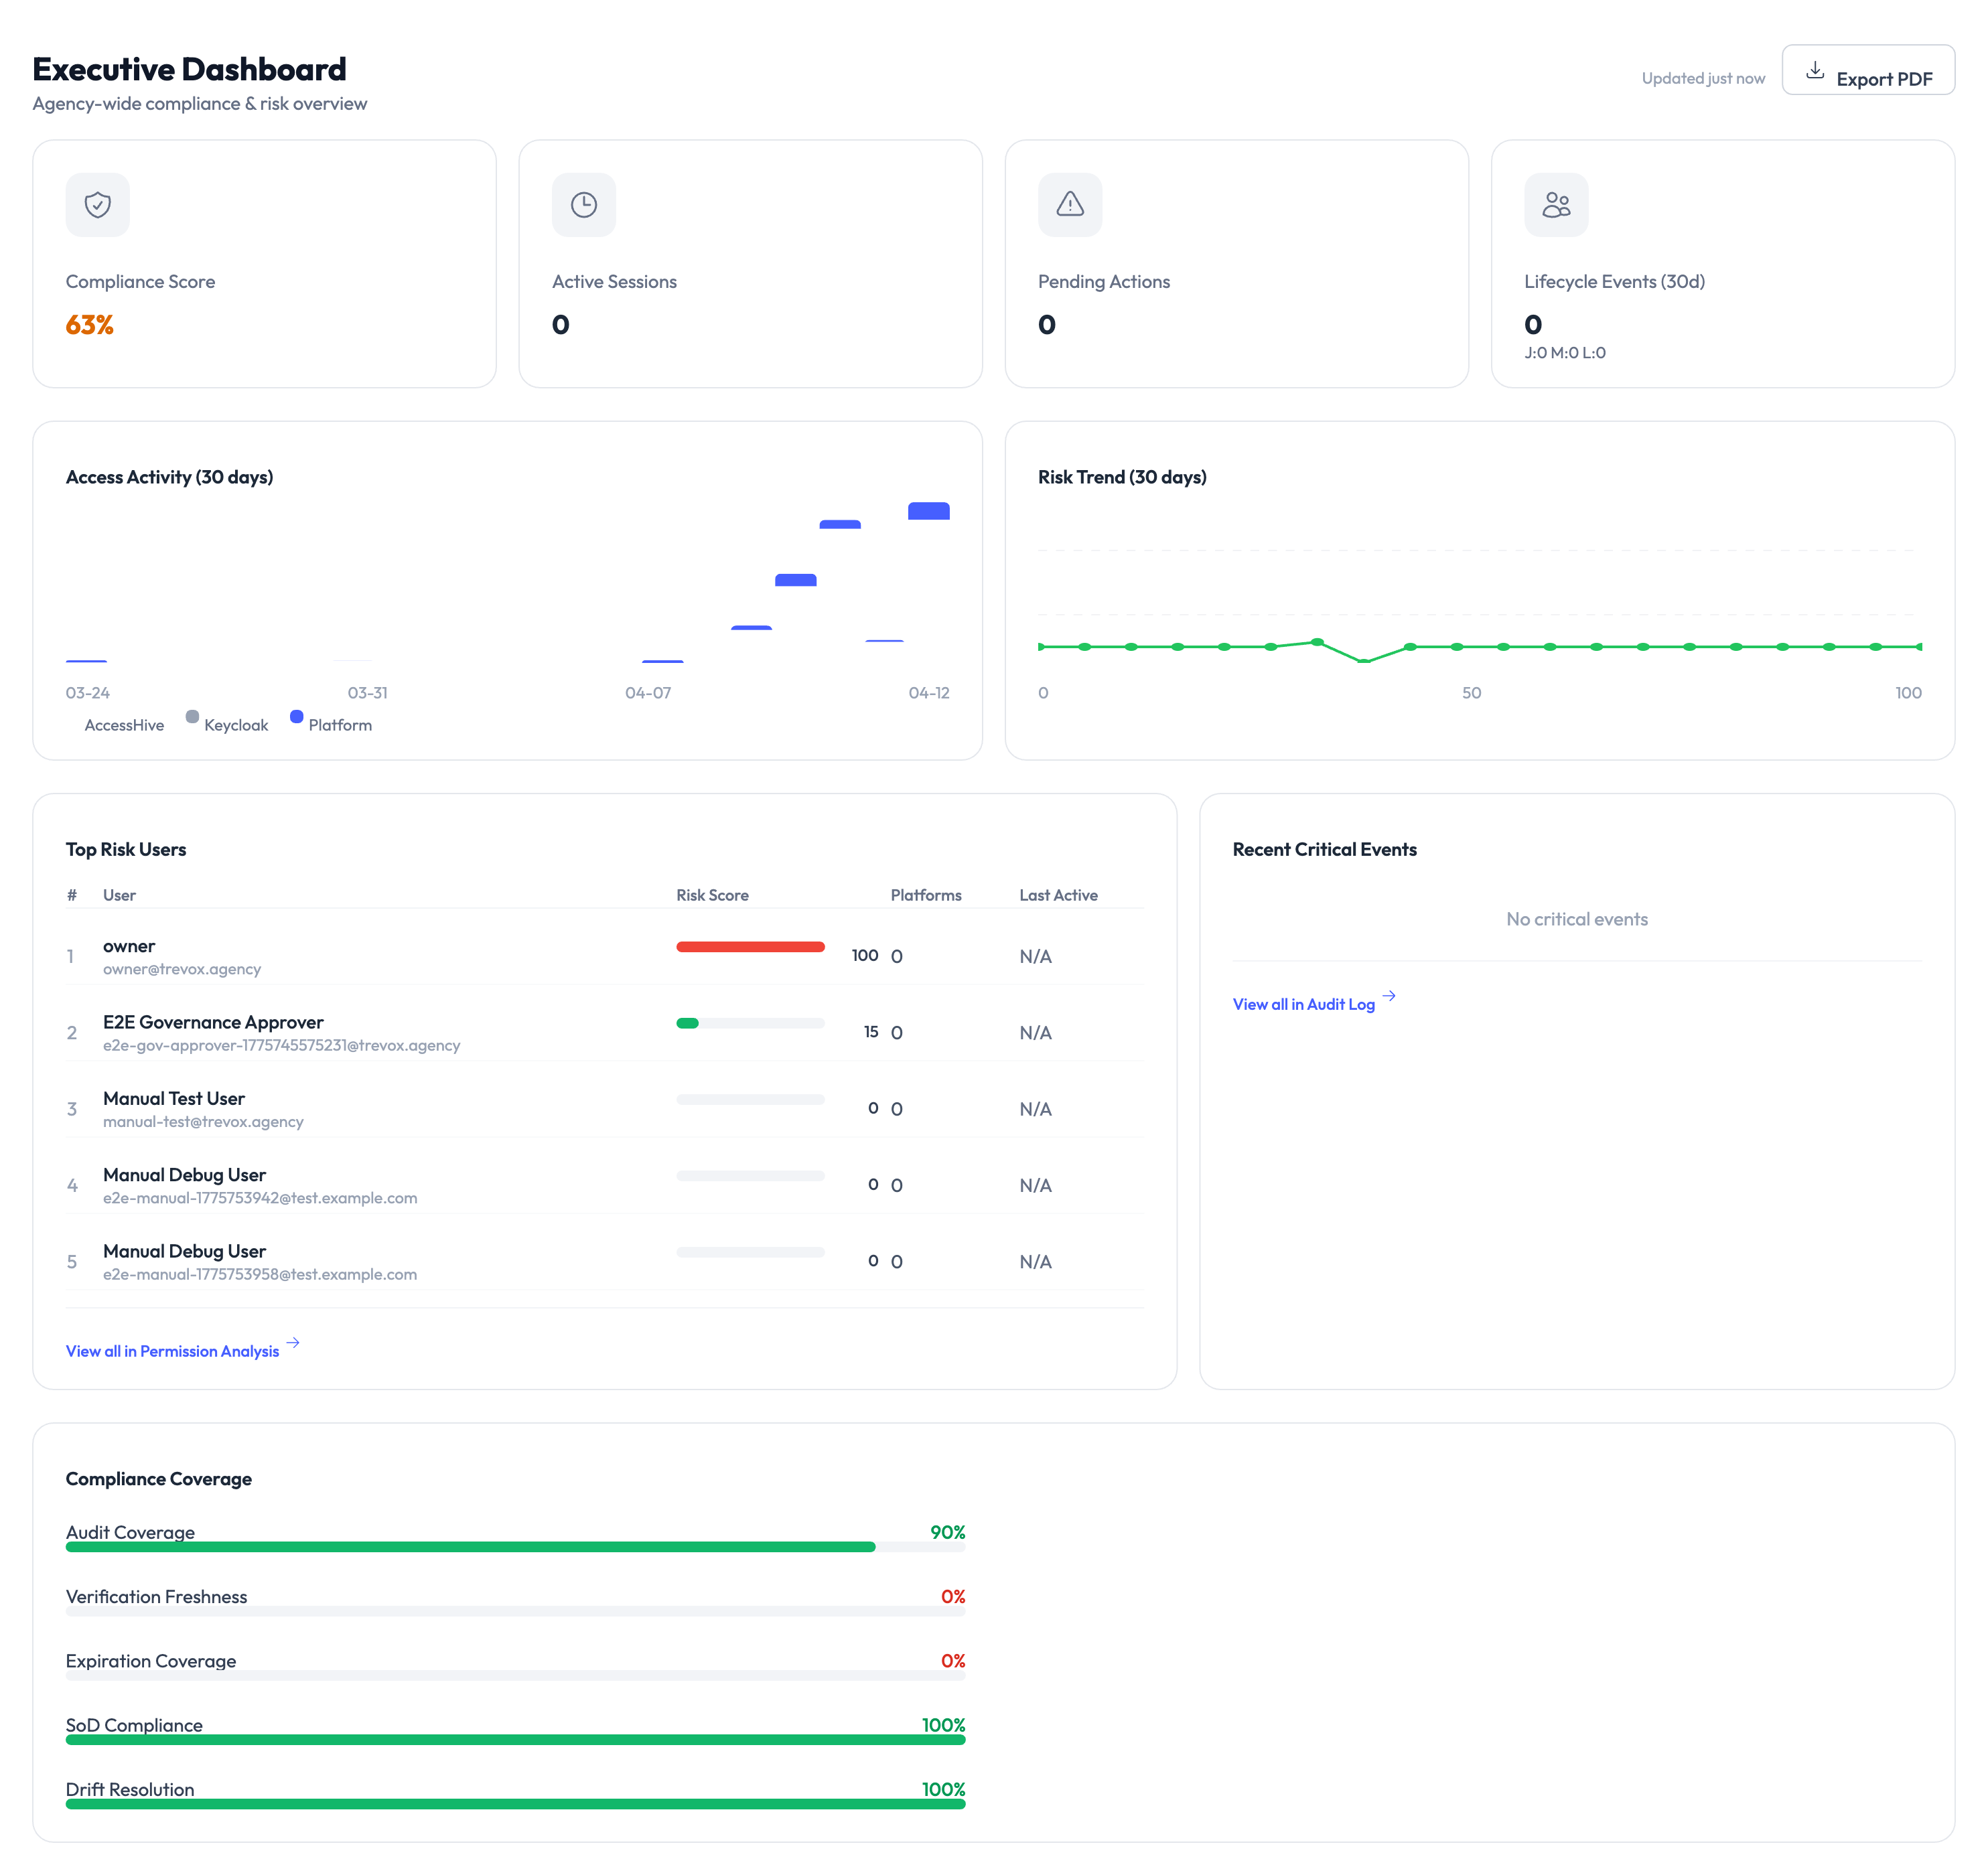
The top of the dashboard shows four summary cards that give you an at-a-glance picture of your agency’s current state.
| Card | What it tells you |
|---|---|
| Compliance Score | A percentage representing how well your agency meets its configured governance policies. Higher is better. |
| Active Sessions | The number of Privileged Access Management (PAM) sessions currently checked out by team members. |
| Pending Actions | Items that need attention – approval requests, expiring credentials, or flagged events. |
| Lifecycle Events (24h) | The count of identity lifecycle events (creations, rotations, deactivations) in the last 24 hours. |
Click Export PDF in the top-right corner to generate a downloadable report of the dashboard. This is useful for sharing security posture updates with leadership or during compliance reviews.
Reading the activity charts
Access Activity (30 days)
The bar chart in the middle-left section shows daily access activity over the past 30 days. Each bar represents the number of credential checkouts and check-ins for that day. Use this to spot usage patterns – spikes may indicate campaign launches or audits, while dips could signal underused identities.
Risk Trend (30 days)
The line chart on the right tracks your agency’s risk score over time. A flat or declining line means your security posture is stable or improving. A rising line means new risks have been introduced – review the Top Risk Users table below to investigate.
Top Risk Users
This table lists team members with the highest risk scores, based on factors like:
- Number of active sessions
- Overdue check-ins
- Access to high-sensitivity platforms
- Policy violations
Each row shows the user’s name, risk score (color-coded), platforms they access, and last active date. Click any user to see their full activity history.
A red risk score means the user has multiple risk factors that may indicate a security concern. Review their access patterns and consider whether their permissions are appropriate.
Recent Critical Events
The panel on the right side shows the most recent security-relevant events, such as:
- Failed login attempts
- Policy violations
- Credential expirations
- Unusual access patterns
Click View All Audit Log to see the complete event history in the Audit Trail.
Compliance Coverage
The bottom section breaks down your compliance posture across several dimensions:
| Metric | What it measures |
|---|---|
| Audit Coverage | Percentage of identities with full audit logging enabled. |
| Notification Freshness | Whether notification rules are current and active. |
| Expiration Coverage | Percentage of credentials with expiration dates set. |
| SoD Compliance | Separation of Duties – whether conflicting roles are properly segregated. |
| Audit Registration | Whether all required audit destinations are configured. |
Each metric shows a progress bar and percentage. Aim for full coverage across all dimensions to maintain a strong compliance posture.
Something went wrong?
Compliance score seems too low
The compliance score factors in all configured policies. If you recently added new governance rules, existing identities may not yet meet them. Review the compliance coverage breakdown at the bottom of the dashboard to see which areas need attention. See Troubleshooting.
Active Sessions count doesn’t match what I expect
The count reflects sessions that are currently checked out and not yet returned. If a team member’s session expired but wasn’t confirmed, it may still show as active. Check PAM Sessions for details on session lifecycle.
Charts show no data
Charts require at least a few days of activity data. If your agency is newly set up, the charts will populate as team members begin checking out credentials and creating identities. See Troubleshooting.
What’s next?
- Investigate risk users – Review access patterns and adjust permissions. See Permission Analysis.
- Review the audit trail – Dig into specific events flagged on the dashboard. See Audit Trail.
- Configure governance policies – Tighten checkout rules and approval workflows. See PAM Sessions.
- Generate reports – Create detailed reports for compliance reviews. See Reports.