SIEM Integration
This guide walks you through connecting AccessHive to your Security Information and Event Management (SIEM) system. Once configured, AccessHive forwards security events – like identity checkouts, policy violations, and provisioning changes – to your SIEM in real time.
Time to complete: About 10 minutes.
- You need the Admin role.
- Have your SIEM’s ingest URL (webhook endpoint or syslog address) ready.
- Know your SIEM’s preferred delivery format: Syslog (RFC 5424), CEF over Syslog, or Webhook (HTTP POST).
Navigate to Settings > SIEM to open the integration page.
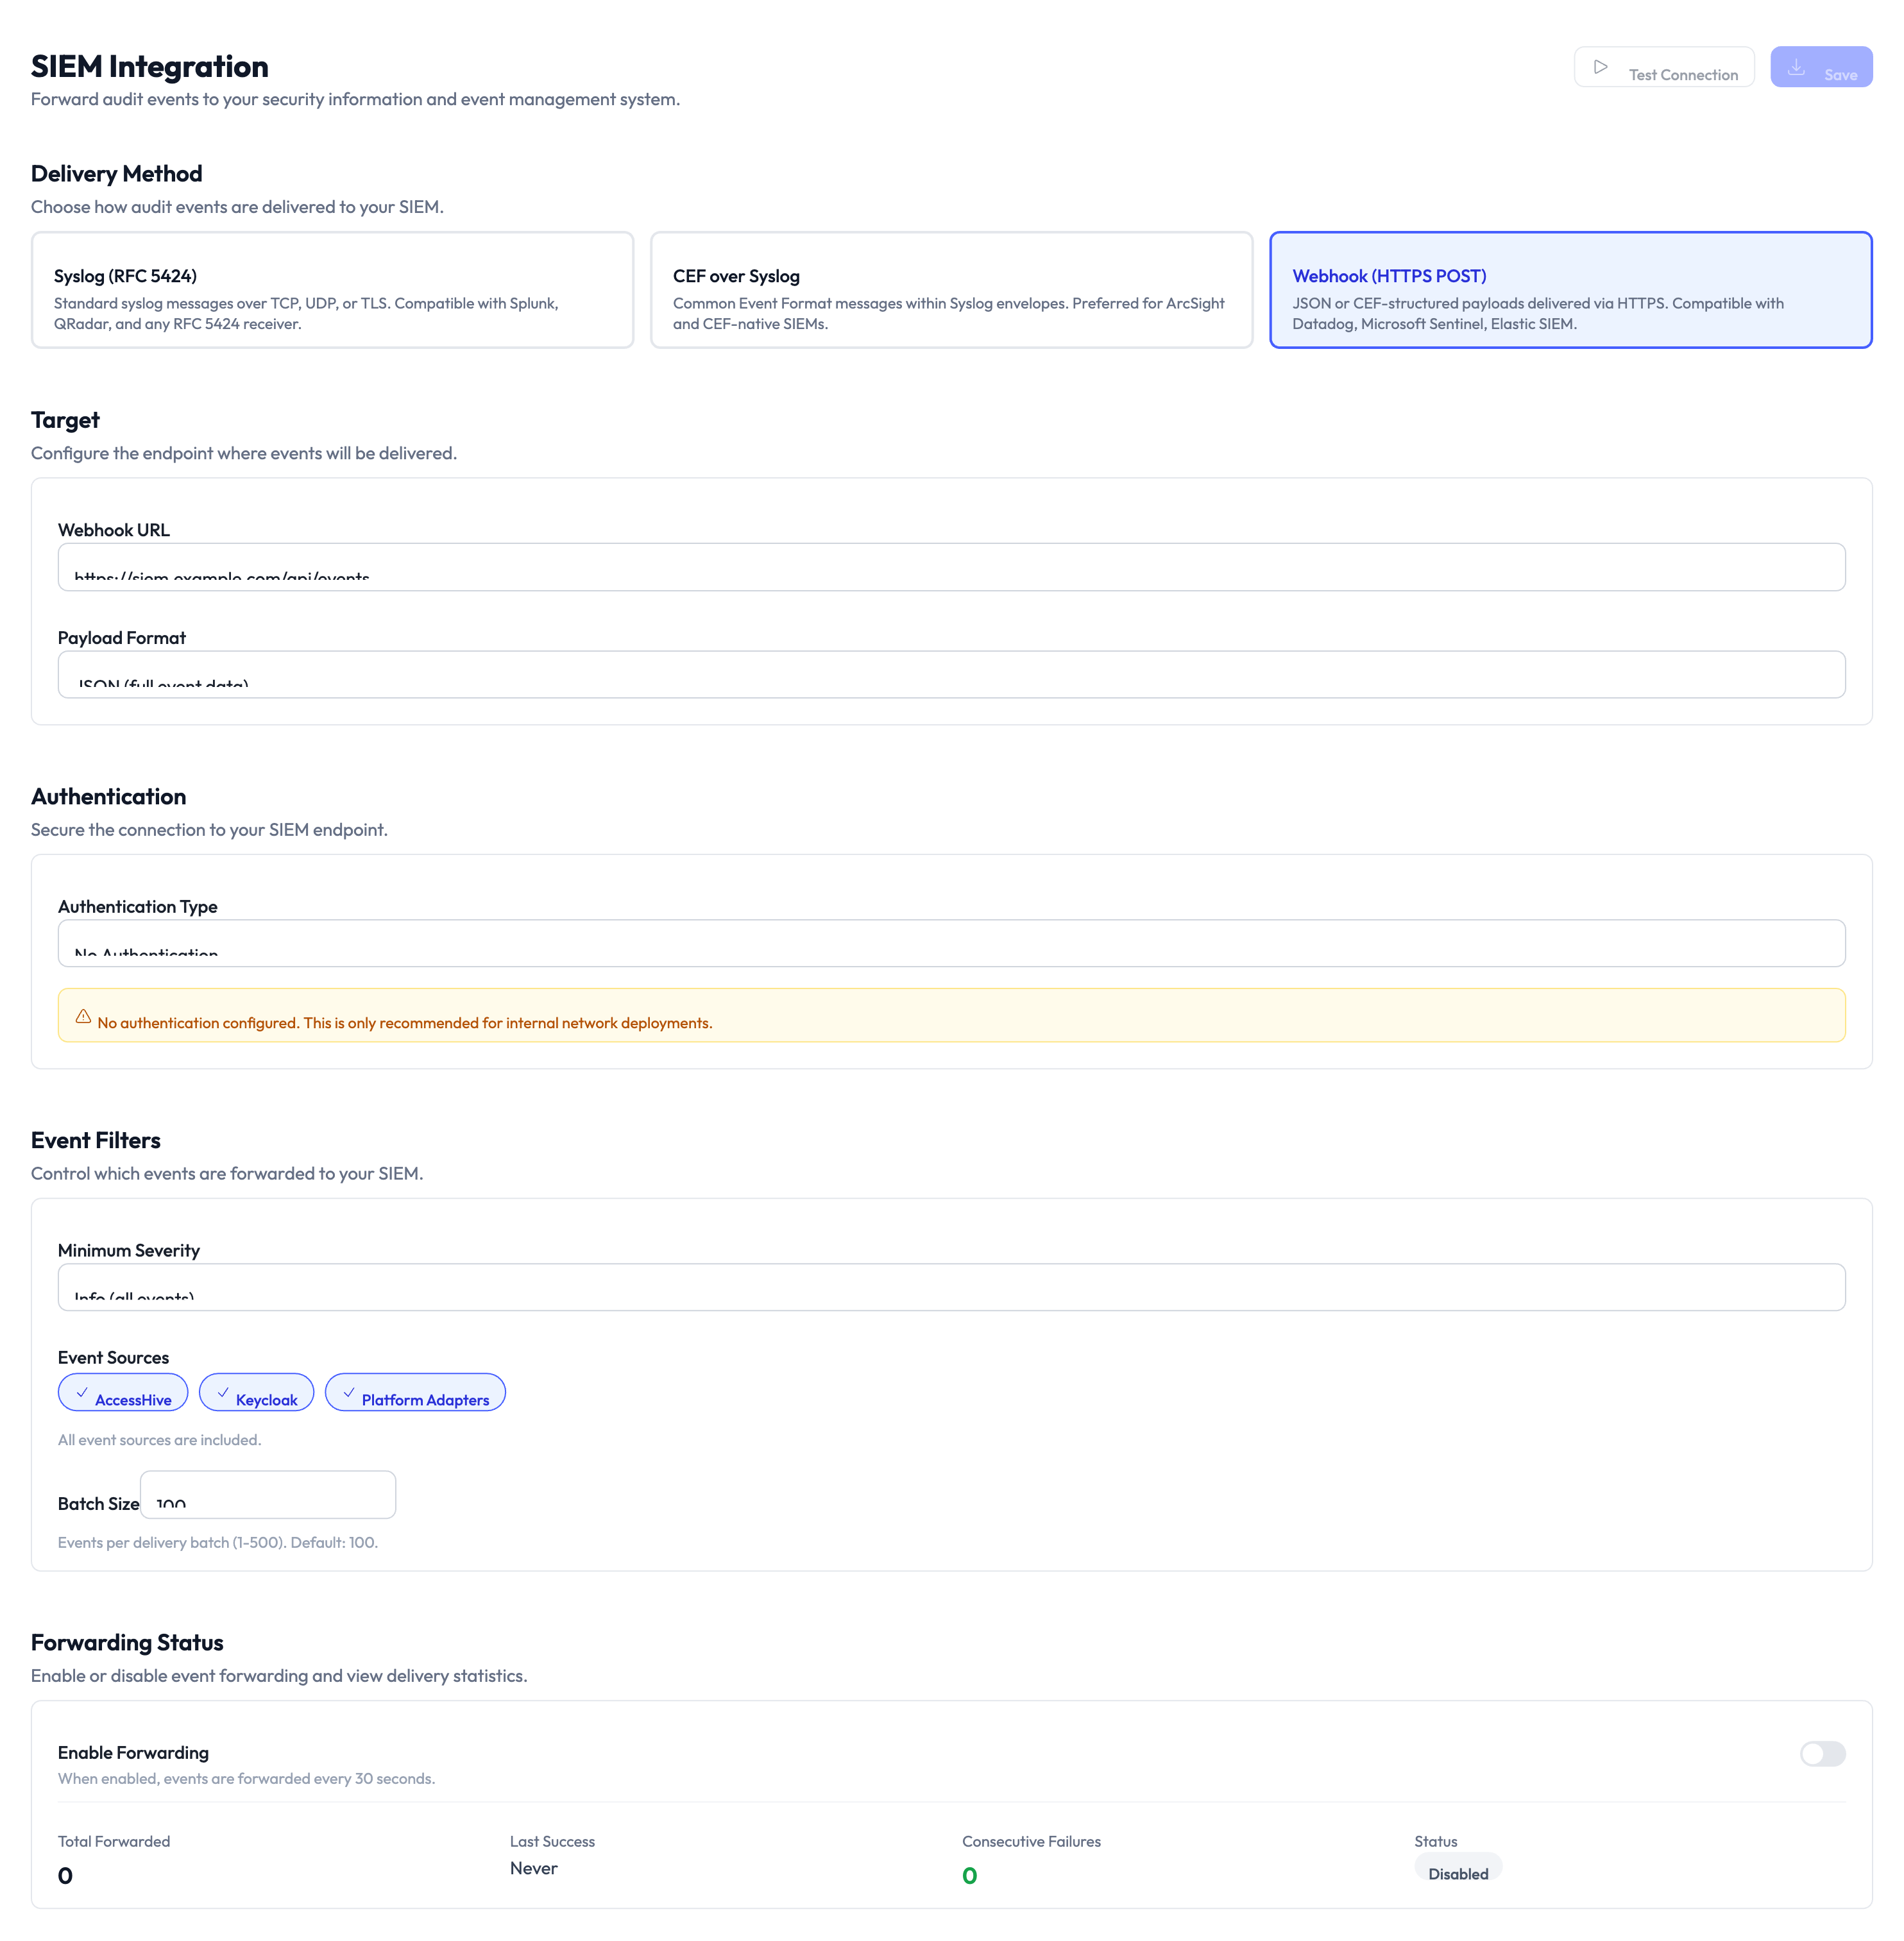
Choose a delivery method
AccessHive supports three methods for sending events to your SIEM. Pick the one your SIEM accepts.
Step 1 — Select the delivery method
Choose one of the three delivery method cards at the top of the page:
| Method | Best for | How it works |
|---|---|---|
| Syslog (RFC 5424) | Splunk, QRadar, ArcSight, and other on-premise SIEM tools | Sends structured syslog messages over TCP, UDP, or TLS. Compatible with most SIEM products. |
| CEF over Syslog | SIEM tools that use Common Event Format for parsing | Sends events in ArcSight Common Event Format (CEF) as syslog messages. Best for structured log analysis. |
| Webhook (HTTP POST) | Cloud-native SIEM tools like Datadog, Sumo Logic, or custom endpoints | Sends JSON event payloads via HTTPS. Compatible with any endpoint that accepts HTTP POST requests. |
Configure the target
Step 2 — Enter the target endpoint
Fill in the target fields based on your chosen delivery method:
- Webhook URL — The HTTPS URL where AccessHive sends event payloads (for Webhook method).
- Syslog host and port — The hostname or IP and port number of your syslog receiver (for Syslog and CEF methods).
- Protocol — Select TCP, UDP, or TLS for syslog delivery.
Set up authentication
Step 3 — Configure authentication
The Authentication section secures the connection to your SIEM endpoint. Select an Authentication Type from the dropdown:
- None — No authentication. Use only for internal network endpoints.
- Bearer token — Sends an authorization token in the HTTP header (Webhook only).
- Basic auth — Sends a username and password (Webhook only).
- TLS client certificate — Uses a client certificate for mutual TLS authentication (Syslog only).
Without authentication, any system that knows the endpoint could receive your security events. Use token or certificate-based authentication for production deployments.
Filter events
Step 4 — Set the minimum severity
Use the Minimum Severity dropdown to control which events are forwarded. Events below this severity level are not sent. Options range from low (sends everything) to critical (sends only critical events).
Step 5 — Select event categories
Use the category toggles to choose which types of events are forwarded:
- Accessibility — Access grant and revocation events.
- Approval — Checkout approval and denial events.
- Policy & Analytics — Governance policy evaluation results and usage analytics.
Toggle each category on or off based on what your security team needs to monitor.
Step 6 — Set batch size
The Batch Size field controls how many events are grouped into a single delivery. A higher batch size reduces the number of requests but adds a small delay. The default works well for most setups.
Enable forwarding
Step 7 — Turn on event forwarding
Toggle Enable Forwarding at the bottom of the page. Once enabled, the system begins sending events that match your filters to the configured endpoint.
The Forwarding Status section shows real-time delivery metrics:
| Metric | What it shows |
|---|---|
| Total Forwarded | The number of events successfully sent since forwarding was enabled |
| Last Success | Timestamp of the most recent successful delivery |
| Consecutive Failures | Number of delivery failures in a row – if this rises, check your endpoint |
| Status | Current state: Healthy, Degraded, or Disabled |
Before going to production, set the minimum severity to its lowest level and enable all categories. Verify events appear in your SIEM, then tighten the filters to reduce noise.
Something went wrong?
Events are not appearing in my SIEM
Verify the target URL or syslog host is correct and reachable from the internet. Check the Consecutive Failures counter on the Forwarding Status panel. If it is increasing, the endpoint may be rejecting requests. Confirm authentication credentials are correct. See Troubleshooting.
Forwarding status shows Degraded
Degraded means some deliveries are failing intermittently. This is usually caused by network timeouts or rate limiting on the SIEM endpoint. Check your SIEM’s ingest rate limits and increase the batch size if needed.
I regenerated my SIEM token and events stopped flowing
Update the bearer token on this page to match the new token in your SIEM. AccessHive continues to retry failed deliveries, so events should resume once the token is updated.
Too many events are being forwarded
Raise the minimum severity level and disable event categories you do not need. For example, if you only care about policy violations, turn off Accessibility and Approval categories and set the severity to medium or higher.
What’s next?
- Set up auto-remediation — Automatically respond to the policy violations your SIEM detects. See Auto-Remediation.
- Review the audit trail — See all security events in AccessHive before they reach your SIEM. See Audit Trail.
- Configure SCIM provisioning — Forward provisioning events alongside security events. See SCIM Provisioning.
- Generate reports — Create scheduled reports for events that complement SIEM monitoring. See Reports.